Power Bi vs Tableau for Beginners
If you have used Power Bi and Tableau, which will you vote to get the work done for you easily? Power BI vs Tableau for beginners isn’t just a software debate; it’s one of the most critical career choices you’ll make as a future data professional.
In Building a Job-Ready Portfolio for Data Analyst Roles, these tools are a must-have.
Picture yourself in a UK job interview: the recruiter leans forward and asks, “So, which tool do you know?” That single answer could mean securing the role or losing it to someone else.
In this guide, I’ll break down both tools like a patient professor, using real UK industry insights and career tips to help you choose the right starting point with confidence.
Why Compare Power BI and Tableau for Beginners?
Choosing your first BI tool sets the early path for you, especially when you land a job without experience. It shapes the work you do, the jobs you see, and the portfolio you build. Power BI and Tableau both make charts and dashboards.
They both help people see how data is analysed. They differ in cost, style and where employers use them. If you choose wisely, you can complete tasks more efficiently.
And there’s no bad choice, but you may need to learn things that are more relevant to your target role.
When you think of Power BI vs Tableau for beginners, think of four practical points.
- Cost to learn and show work.
- How fast can you make a functional dashboard?
- Where the jobs are.
- How the tool helps you grow into more challenging work in the future.
Use those points to guide your choice. The rest is skills and practice.
Importance of Data Visualisation Skills in Today’s Job Market
A good data visualisation helps teams move faster. Most managers prefer clear visuals over long reports.
For many UK roles, a single dashboard can demonstrate your ability to think with data.
That skill is now core, and it appears on many entry-level job adverts. Data visualisation skills win interviews and can help you advance your career in data analysis.
Simple, clear visuals are more useful than complex models. Learning to ask good questions, pick the correct chart and explain one insight in one sentence; these basics prepare you to use any tool well.
A good Power BI beginner guide or a short Tableau primer should focus on those basics.
Too many beginners start with features. Start with questions instead. That small shift speeds learning and makes your valuable work to real teams.
Why Beginners Often Choose Between Power BI and Tableau
People choose for three plain reasons: cost, speed, and job fit.
- Cost: Can you practice for free? Yes. Power BI Desktop is free. Tableau Public is free for public work. Paid tiers appear for teams and governance.
- Speed: How fast can you make something useful? Power BI is close to Excel. Many find it faster to get quick wins. Tableau invites visual play and exploration. That can lead to deeper insights but may take a little longer at first.
- Job fit: Which tools do the employers you want to list? Corporate teams often list Power BI, while consultancies, media, and research teams often list Tableau. Check job boards for your target roles and use that to pick your first tool.
This practical view is the centre of a clear Power BI vs Tableau comparison for beginners.
See Also:
Key Features of Power BI for Beginners
Source: Power BI
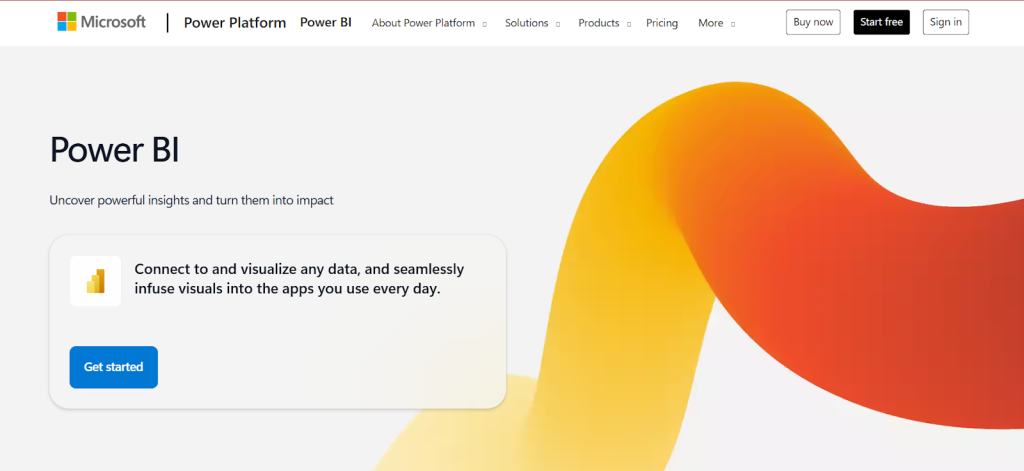
Power BI is developed by Microsoft and integrates well with Office 365. That matters in many UK firms. Power BI Desktop lets you import Excel files.
You get to clean data with Power Query and it uses drag-and-drop visuals. You can make a clear dashboard fast.
Power BI grows with you. From simple charts, learn DAX for measures, and later learn modelling and performance. For many entry roles, the basic reports do the work. Power BI lets you reach that practical level quickly.
Ease of Use and Microsoft Integration
Power BI looks familiar if you use Excel. I mean, the Pivot table skills help. The interface uses panes and a canvas. Cleaning data is often a few clicks. Additionally, sharing inside Teams or SharePoint is simple.
For someone starting out, this reduces friction and helps build your confidence. This is why many UK job ads list Power BI with Excel.
If you need a low-cost start, Power BI is a practical choice. It often answers the question of how to show real skill fast.
Pricing and Accessibility for Entry-Level Users
Power BI Desktop is free for individuals. That is key for students and solo learners. For sharing inside a business, Power BI Pro and Premium tiers apply.
For a beginner building a portfolio, the free desktop version and published images are enough. This makes Power BI one of the most accessible data visualisation tools for entry-level analysts.
When employers need secure sharing, they will fund the paid tiers. For early learning, start free and build small projects. This keeps costs low and learning steady.
Learning Curve for New Data Analysts
For a new data analyst trying to set career development goals, Power BI’s first steps are short. Import, clean, chart, publish. That sequence gives fast feedback. You can make a useful dashboard in a few focused sessions.
The next steps take more practice: better models, DAX, and optimisation. However, many entry-level roles require clarity and repeatable reports, rather than advanced modelling.
So you can be helpful early. The Power BI vs Tableau learning curve is gentler on the first steps. That helps beginners land a first job sooner.
See Also:
Key Features of Tableau for Beginners
Source: Tableau
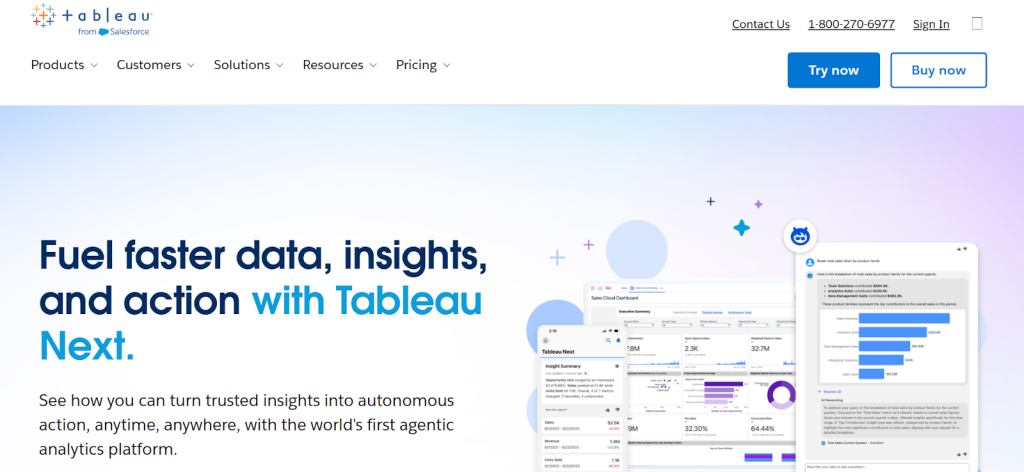
Tableau is design-first. It invites visual exploration. The interface is visual. You drag fields and watch views appear. This supports curiosity. Tableau helps you test many views fast.
That is useful when you need to find a hidden pattern.
Tableau Public is free to publish public work. You can post portfolio pieces and show them to employers. Many people use Tableau to build standout visual stories. If you enjoy crafting visuals that people enjoy exploring, Tableau may be a good fit for you.
Flexibility and Advanced Visualisations
Tableau gives fine control over visuals. You can make layered charts and add interactivity. Actions and parameters let users explore a story. Consultancies and media teams often value that.
If you want polished, interactive dashboards, Tableau delivers. It is often called the best data visualisation tool for beginners who value presentation.
The trade-off is a small extra learning step at first. But the outcome can be a highly polished portfolio piece.
Community and Learning Resources
Tableau Public is full of examples you can learn from. Many authors publish dashboards and workbooks that you can download. That makes learning by instance easy.
Courses, bootcamps and forums support fast progress. Beginners can copy a dashboard, rebuild it, and then add their own twist. That practical loop moves you from imitation to original work faster.
This learning model is ideal for those who learn by doing and by copying good examples.
Cost Considerations for Students and Professionals
Tableau has tiered licences for business. For learners, Tableau Public and students offer a lower cost. For organisational use, Creator and other paid tiers apply.
At scale, Tableau can cost more than Power BI for big teams. Still, many organisations accept that cost for visual power.
If your path is consultancy or data journalism, the cost can be worth it. For solo learners, start with Tableau Public to learn without a big fee.
See Also:
- Business Intelligence Analyst Bootcamp – All You Need To Know
- Volunteer Experience to Add to Your CV
Power BI vs Tableau: Which Is Better for Beginners?
If you are thinking, Tableau or Power BI: Which is Better for Career Growth? Both tools work well. Which is better depends on your goal. If you want fast entry into corporate roles, Power BI often fits. If you want standout visuals for clients or the public, Tableau often fits.
When analysing Power BI vs Tableau for beginners, many people ask if they should learn Power BI or Tableau first. The best rule is to pick the tool that matches the roles you will apply to in the next six months. Then add the other later.
Both tools teach the same core skills. Clean data. Ask a clear question. Pick the right chart. Tell one insight. That process is what hiring managers value more than the exact menu options you use.
Cost Comparison and Licensing
Both tools have free ways to start. Power BI Desktop is free. Tableau Public is free. For team sharing and governance, paid tiers exist.
Power BI often costs less at scale if a firm already uses Microsoft 365. Tableau can be pricier for full authoring rights at enterprise scale.
For beginners, start free and work to show. Employers usually provide paid access when needed.
This simple cost view answers many practical learner questions about Power BI vs Tableau pricing.
Ease of Learning and Support Resources
Power BI is often easier if you come from Excel. Tableau can feel more visual and creative. Both have strong learning resources.
Vendor docs, YouTube, MOOCs, and community workbooks help. Pick the path that suits your learning style. If you prefer quick wins and business reports, choose Power BI.
If you enjoy play, design and polished interactivity, choose Tableau. This choice is the core of many tutorials on data visualisation tools for entry-level analysts.
Industry Demand and Career Opportunities
Both tools appear on UK job boards. Power BI shows up often in corporate analyst roles. Tableau shows up in consultancies and media roles. Junior analyst salaries in the UK vary by location.
A strong portfolio often matters more than many tool names. Build two good projects and show one clear insight for each.
That will help in interviews and open the best Tableau vs Power BI career opportunities for you if you are looking to Switch Career into Tech UK With No Experience.
How to Choose the Right Tool for Your Career Path
Match the tool to the job you want. Pick Power BI if you aim for in-house roles in firms using Microsoft 365.
Pick Tableau if you aim for consultancy, media, or research, and you want interactive public work. Either start is fine. The smart path is to learn one well and add the other later.
Power BI for Corporate and Business Roles
Power BI works well in many businesses. It fits into Teams and SharePoint. As a beginner, build a weekly dashboard that replaces a manual spreadsheet. Show the time saved and the key insight. That is the kind of impact employers notice. This simple step helps you get hired faster for corporate roles.
Tableau for Research, Consulting, and Data-Heavy Roles
Tableau lets you test many views fast. Consultants use it to show clients different angles. Researchers use it to find patterns.
If you want public-facing or client-facing visuals, Tableau helps you build work that stands out. Use Tableau Public to host portfolio pieces that show your visual craft.
See Also:
Combining Both Skills for Competitive Advantage
The highest-value path is cross-tool skill. Start with one that gets you hired fast if you are just starting your career as a data analyst. After three months of regular use, add the other.
This makes you flexible. Employers like people who can work with the stack they own. This is one of the best Career Advice For Job Seekers in The UK. Knowing both tools opens more roles and raises your value.
Conclusion
Choosing between Power BI and Tableau is only the beginning of your data journey. The real growth happens when you commit to structured learning, guided practice, and a community that pushes you forward.
That’s exactly what the RKY Careers Data Analysis Bootcamp offers.
In just a few weeks, you will gain hands-on projects using both tools, mentorship from experienced analysts, and insider strategies to stand out in the UK job market.
Beyond technical skills, we provide career coaching, CV polish, mock interviews, and lifetime access to an active alumni network.
You don’t just learn dashboards; you learn how to solve real business problems, showcase impact, and get hired.
Whether your goal is to land your first analyst role or to transition into data from another field, RKYCareers Bootcamp gives you clarity, confidence, and results. Your career deserves this start.
FAQs
Is Power BI easier to learn than Tableau for beginners?
Often yes. Power BI is closer to Excel and gives quick wins. Tableau takes more visual thinking at first but pays off in polished visuals.
Which tool has better job opportunities in the UK: Power BI or Tableau?
Both are in demand. Power BI is common for corporate roles. Tableau is common for consultancies and media.
Can beginners learn both Power BI and Tableau at the same time?
Yes. But most people learn one well first by building projects. Core skills transfer between tools.
What free resources are available to learn Power BI and Tableau?
Power BI Desktop and Tableau Public are free. Vendor tutorials, Coursera, edX and YouTube have many project-based lessons.