
How Data Is Analysed
In today’s data-driven world, knowing how data is analysed gives you a competitive edge. From predicting trends to solving business problems, professionals now rely on data analysis not as a niche skill but as a must-have tool for decision-making and career growth.
You want to thrive in this fast-paced scene? You need data.
Whether you are a mid-career professional seeking to sharpen your strategic decision-making, a career changer aspiring to enter the vibrant world of data, a job seeker aiming to carve out a competitive edge, or a dedicated professional committed to continuous upskilling, you have arrived at the right resource.
What Is Data Analysis?

Before we delve into the more intricate aspects of how data is analysed, it is essential to establish a solid foundation in the basics. So, what exactly is data analysis? While it can sound highly technical, the underlying concept is surprisingly intuitive: it is about making clear, logical sense of the vast amounts of information we encounter.
Definition and Importance of Data Analysis
Data analysis is a comprehensive process that involves inspecting, cleansing, transforming, interpreting, and modelling data, with the ultimate goal of discovering useful information, informing robust conclusions, and supporting effective decision-making.
The importance of thoroughly understanding how data is analysed cannot be overstated in today’s digitally-driven global landscape. Businesses leverage data analysis to gain deeper insights into customer behaviour, optimise operations, and predict market trends.
Analytical thinking is consistently ranked as one of the most in-demand skills. A 2023 report by the World Economic Forum underscores this, highlighting it as a critical competency.
The global big data and analytics market’s explosive growth directly translates into a soaring demand for professionals proficient in analysing data. This knowledge empowers you to ask insightful questions and make evidence-based decisions.
If you are contemplating a significant career shift into a more data-centric role, learning how data is analysed is a strategic imperative. Indeed, possessing data analytical skills is a high-income skill and is in increasing demand in the job market.
Types of Data: Qualitative vs Quantitative
A fundamental aspect of learning how data is analysed involves a clear understanding of the nature of the data itself. Data primarily falls into two broad categories:
Quantitative Data: This refers to any data that can be measured or counted numerically, such as numbers, measurements, or counts. It answers questions like “how many” or “how much.” Examples include sales figures and website traffic.
Quantitative data is often analysed using statistical methods. When we discuss how data is analysed statistically, we are frequently dealing with quantitative information, which can either be discrete or continuous.
Qualitative Data: Also known as categorical data, this type is descriptive and non-numerical in its raw form. It answers “why” or “how.” Examples include customer reviews, interview transcripts, or brand perceptions.
Analysing qualitative data involves identifying themes and narratives. You need to understand how data is analysed to gain deep contextual insights.
The choice of data analysis methods frequently depends on whether your data is quantitative, qualitative, or a blend of both. Understanding this distinction is, therefore, essential in learning how to analyse data.
Common Data Analysis Methods
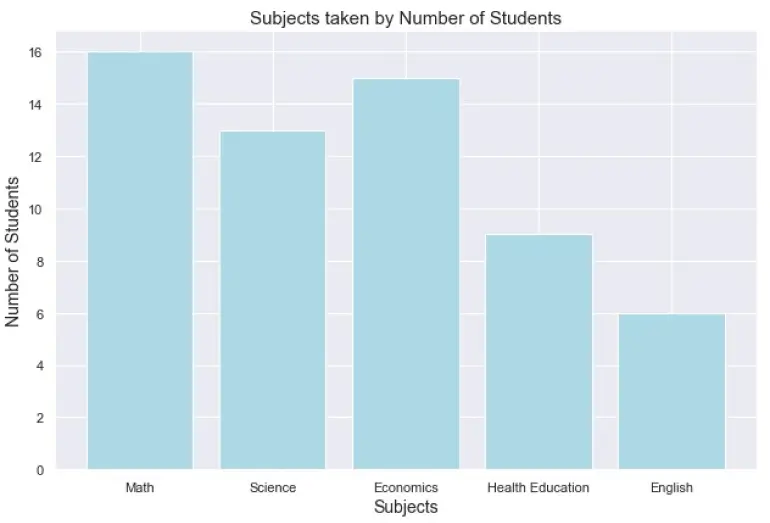
Image Credit: Polymer
Knowing how data is analysed means being familiar with key analytical approaches. Here are standard data analysis methods:
- Descriptive Analysis: Answers the question, “What happened?” It summarises data features using metrics like mean, median, and frequencies. This is often the first step in the data analysis process.
- Diagnostic Analysis: Answers the question, “Why did it happen?” It digs into the root causes behind descriptive findings, using techniques such as drill-downs or correlation.
- Predictive Analysis: Answers “What is likely to happen?” It utilises historical data, statistical algorithms, and machine learning to forecast future outcomes, such as sales forecasts.
- Prescriptive Analysis: Answers “What should we do about it?” This advanced method recommends actions to achieve desired outcomes using optimisation or simulation.
- Inferential Analysis: This approach uses a sample of data to make inferences about a larger population, employing techniques such as hypothesis testing.
Steps Involved in Data Analysis
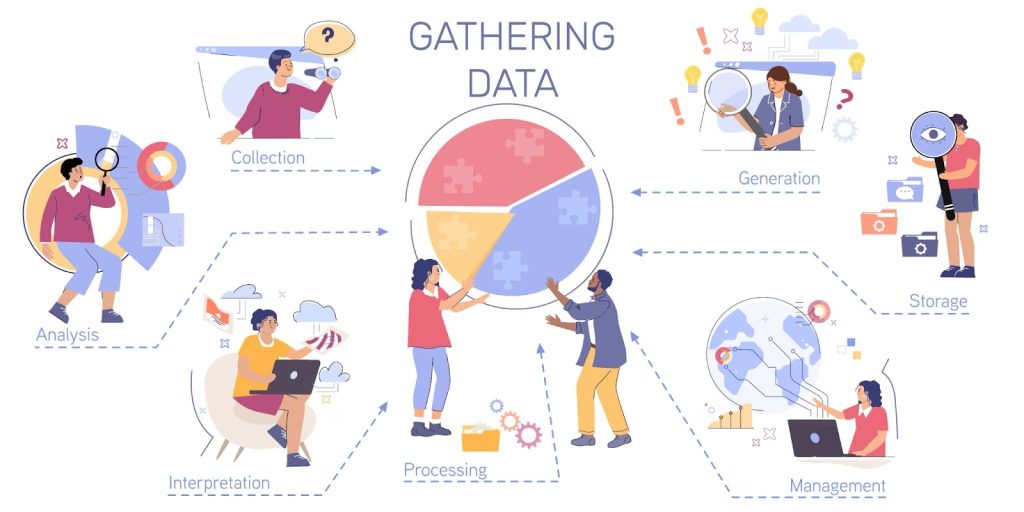
Understanding how data is analysed is about grasping the entire data analysis process as a systematic journey. This process involves several key steps, showing you how to analyse data from start to finish.
Data Collection and Cleaning
This involves gathering information, handling missing data (imputing or removing), correcting errors and typos, removing duplicates, standardising formats, and dealing with outliers. Without thorough cleaning, analysis can lead to misleading conclusions.
- Data Collection: This involves gathering information from primary sources, such as surveys and experiments, as well as secondary sources, including existing reports and public databases.
- Data Cleaning: This is a critical component of the data analysis process. Raw data is often full of errors, missing values, or inconsistencies. Data cleaning techniques prepare it for analysis.
Data Exploration and Data Visualisation
Once data is clean, you explore it. Exploratory Data Analysis (EDA) summarises data characteristics, often visually. It is about getting to know your data and spotting patterns, anomalies, and relationships before formal analysis.
Data visualisation tools are invaluable. Charts, such as histograms, scatter plots, and box plots, reveal insights hidden in raw numbers. This initial exploration guides the deeper analytical stages of how data is analysed.
Applying Statistical Techniques
This stage of data analysis involves rigorously testing hypotheses and quantifying relationships using formal statistical methods. The techniques depend on your research question and the type of data you are working with. Common methods include:
- Hypothesis Testing: Making statistically supported decisions about a population based on sample data.
- Regression Analysis: Modeling the relationship between a dependent variable and one or more independent variables to predict or explain outcomes.
- Correlation Analysis: Measuring the strength and direction of the linear relationship between two quantitative variables. Other methods, such as ANOVA or time series analysis, may also be used. This is where statistical analysis software becomes essential for applying these complex techniques efficiently.
Drawing Conclusions and Making Decisions
Interpreting results to draw meaningful conclusions and drive informed decisions is the culmination of the data analysis process. It is where data analysis translates into actionable intelligence.
This involves understanding what your analysis results mean in context, relating findings to your initial questions, acknowledging any limitations of your study, clearly communicating your findings to stakeholders (often through storytelling with data), and recommending specific actions based on your data-backed conclusions.
Tools and Software Used for Data Analysis
|mage Credit: Freepik
To effectively understand how data is analysed, you will need data analysis tools. The choice depends on data size, analysis complexity, and proficiency.
Excel and Google Sheets
For many beginners or those with smaller datasets, spreadsheets such as Microsoft Excel and Google Sheets serve as the entry point. They are accessible and valuable for data organisation, basic calculations, simple charts, and pivot tables.
SQL and Databases
When data resides in relational databases, SQL (Structured Query Language) is indispensable. It allows you to retrieve, filter, join, and aggregate large datasets. Anyone serious about learning how data is analysed from database systems must learn SQL to extract and prepare complex data effectively.
Statistical Software: R, Python, SPSS
For more advanced work, specialised statistical analysis software is vital.
- R: This is a free environment built for statistical computing and graphics. Powerful and widely used in academia, it is known for its extensive packages.
- Python: A versatile language with libraries like Pandas, NumPy, and Scikit-learn, making it a top choice for the entire data analysis process. Its popularity in the data analytics tools UK job market is high.
Understanding Python is crucial for analysing data in many modern contexts. It is a highly in-demand tool every Data Analyst should possess should they choose to explore the increasingly competitive UK job market.
- SPSS: This is a commercial software widely used in the social sciences, recognised for its user-friendly graphical interface and robust capabilities for traditional statistical tests.
Data Visualisation Tools: Tableau, Power BI
Data analysts use tools like Tableau and Microsoft Power BI for creating interactive dashboards and reports. They help communicate complex findings from your analysis in an accessible, engaging way.
Employers highly value proficiency in these tools, as they help bridge the gap between raw data and actionable intelligence. When showcasing these skills on your CV, ensure they stand out.
Presenting a professional CV is just as crucial as acquiring invaluable skills. To do this, you should avoid these common CV mistakes, or better still, leave it to the professionals.
Challenges in Data Analysis and How to Overcome Them
The path of how data is analysed has its obstacles. Awareness of these standard data analysis challenges is crucial to ensuring the integrity of your findings.
Handling Missing or Incomplete Data
Missing data is a frequent issue that can bias results if not handled properly. To overcome this, try to understand why data is missing. Then, consider data cleaning techniques like:
- Deletion (with caution): Removing records if missing details are minimal and random.
- Imputation: Filling missing values using statistical methods like mean/median imputation for simple cases or more advanced regression imputation or multiple imputations for complex scenarios. Some algorithms can also inherently handle missing data.
Avoiding Bias and Errors
Bias (e.g., selection, confirmation bias) and errors can distort analytical findings, posing significant challenges to data analysis. To nip this in the bud, take note of the following:
- Be aware of common biases and actively work to counteract them.
- Use proper random sampling techniques to ensure representativeness.
- Implement blinding in experiments where applicable.
- Follow standardised procedures for data collection and analysis.
- Encourage peer review and collaboration to get fresh perspectives.
- Employ critical thinking, constantly questioning assumptions and interpretations.
Ensuring Data Privacy and Security
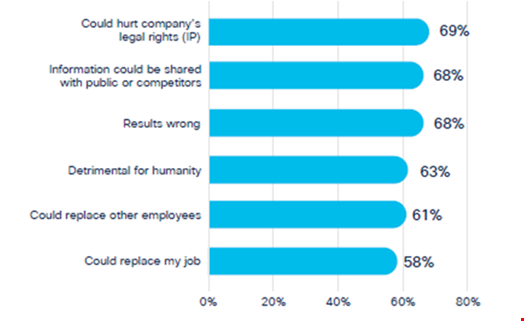
Image Credit: Infosecurity Magazine
Protecting data, especially personal data, is a critical legal and ethical obligation central to data analysis. Regulations like GDPR in Europe (and its UK counterpart) impose strict rules. To ensure data privacy and security, you should consider these tips:
- Employ anonymisation or pseudonymisation techniques to de-identify data used for analysis.
- Practice data minimisation by collecting only the data strictly necessary for your purpose.
- Implement robust security measures, including secure storage, encryption, and strong access controls.
- Ensure full compliance with all relevant data privacy laws and obtain necessary consent.
- Establish and follow clear data governance policies and ethical guidelines.
You now know the methods, the tools, and the challenges, yet showcasing your newfound or existing analytical skills on a CV and confidently articulating your insights during high-stakes interviews is a different challenge altogether.
This is where your journey meets our expertise. At RKY Careers, we specialise in helping professionals like you navigate these critical transitions. We will help you craft a convincing, data-focused CV that speaks the language of recruiters and gets you noticed.

Our expert interview coaching will prepare you to confidently demonstrate your analytical prowess, turning complex project discussions into job offers.
Do not just learn about data analysis, let us help you build a thriving career with it. Contact RKY Careers today to schedule a consultation and start transforming your data skills into your next great opportunity.
FAQs: How Data is Analysed
1. What are the main techniques used in data analysis?
Key data analysis methods include descriptive (what happened), diagnostic (why it happened), predictive (what will likely happen), and prescriptive (what to do about it) analysis.
2. How do data analysts ensure data quality?
Through rigorous data cleaning techniques and validation: profiling data, correcting errors, handling missing values, removing duplicates, standardising formats, and validating data.
3. Which software is best for beginners in data analysis?
Excel/Google Sheets for basics; SQL for database interaction; Python (with Pandas) for a programming start; Tableau or Power BI for visualisation. The choice depends on learning style and goals.
4. How long does a typical data analysis project take?
It varies widely based on scope, data quality and availability, tool proficiency, and objective clarity. Simple tasks may take hours, while complex projects can span weeks or months.


