Google Analytics Metrics to Track (Essential Guide for 2025)
The most essential Google Analytics metrics to track are like a GPS for your online business. Without them, you’re driving blind. Every click, every visitor, and every page view tells you a part of your story.
This guide will show you the key Google Analytics metrics to track in 2025. We’ll start with the basics and move to more advanced GA4 topics.
By the end, you’ll know how to use data to make better business decisions.
What Are Google Analytics Metrics?
What do I mean? Simply put, Google Analytics metrics are the numbers that measure your website’s performance.
They are the values that represent how users interact with your site. These aren’t just random digits; they are the key performance indicators (KPIs) that give business intelligence.
By actively monitoring these metrics, you can make informed decisions to enhance your website. You can also enhance the user experience and ultimately grow your business.
Definition and Why They Matter
Simply put, a metric is a number. It is a value that tells you how many, how long, and how often your website’s performance. Why do these numbers matter? Think about it: without them, you cannot measure your progress.
A 2025 report states that three-quarters of businesses are reporting on how their marketing campaigns are directly influencing overall revenue. This illustrates the importance of data in achieving business success.
The ability to measure your marketing KPIs with Google Analytics is not just a “nice to have.” It is a must-have for survival in today’s market.
Metrics vs Dimensions in Google Analytics Explained
This is a crucial distinction to make. In Google Analytics, a metric is a numerical value, while a dimension is an attribute associated with that metric. For example, “Users” is a metric, but “Country” is a dimension.
This is how you can answer questions like, “How many users (metric) came from Nigeria (dimension)?” Dimensions give context. They make your metrics meaningful.
Key Google Analytics Metrics Every Business Should Track
Now, let’s get down to business. There are so many numbers in Google Analytics that it can be overwhelming.
The bottom line is, you need to focus on the ones that tell you the most about your audience. These are the basic website performance metrics that every professional needs to know.
Users and New Users
First, let’s look at the “Users” and “New Users” metrics. “Users” is the total number of unique people who visited your site. “New Users” tracks how many of those visitors were seeing your site for the very first time.
Tracking these metrics helps you see how your audience is growing. A steady increase in new users indicates that your marketing efforts are effective. But what are they doing once they get there?
Sessions and Session Duration
Sessions track the total number of visits to your website. A single user can have many sessions. This metric indicates the frequency at which visitors return to your site. Average Session Duration, on the other hand, tells you the average time a user spends on your site during a visit.
Bounce Rate vs Engagement Rate
In the past, bounce rate was a key metric. It measured the percentage of single-page visits to your site. It did not always give the full picture. Now, with GA4 metrics explained, “Engagement Rate” is a better metric. It measures the percentage of visits that were “engaged.”
This means the user was on the site for more than 10 seconds, viewed at least two pages, or completed a conversion event. A 2025 study on web performance by InMotion Hosting found that sites with poor performance see a 25% higher bounce rate.
The bottom line? Focusing on a good engagement rate is a much better way to measure user interaction. This is just one of many bounce rate alternatives that give you more context.
Read Also:
Pages per Session
This metric tracks the average number of pages a user views during a single visit. A higher number is usually a good sign.
It suggests that users are exploring your site and are interested in your content. This indicates that your internal links are functioning properly and that your content is engaging enough to keep users clicking.
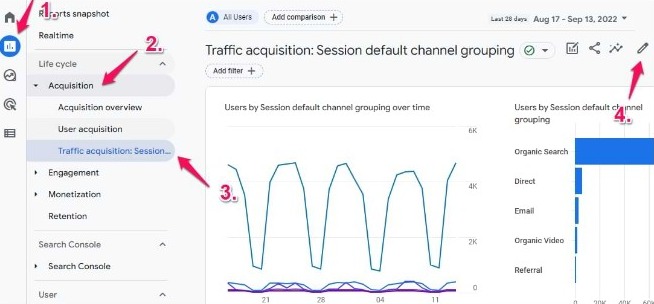
Image Credit: Analytics mania
Traffic Sources (Organic, Paid, Social, Referral)
Traffic sources tell you whether a user came from a search engine (organic), an ad (paid), social media (social), or a link on another site (referral). This is how you can measure the effectiveness of your various marketing channels.
You can’t truly understand the Google Analytics metrics to track without this data. According to WordStream‘s 2025 data, 53% of all website traffic comes from organic search. This makes it a key source to watch.
Goal Completions and Conversion Rate
A “conversion” refers to any significant action a user takes on your site. This could be a purchase, filling out a form, or signing up for a newsletter. “Goal Completions” is the count of these actions. The “Conversion Rate” is the percentage of visits that result in a conversion.
This is the most important of all marketing KPIs from Google Analytics. A 2025 report shows that GA4 can track both session and user conversion rates. This gives you better insights into what users are doing.
Average Engagement Time
This metric, as part of the GA4 metrics explained, is the total time your website was on a user’s screen. It is a more accurate way to measure active engagement.
A higher average engagement time shows that users are truly interacting with your content. It is a strong indication of the value of your content.
Page Views and Top Landing Pages
Page Views are the total number of times a page was viewed. This differs from unique page views, as one user can view the same page multiple times. Top Landing Pages is a report that shows you which pages users first land on when they arrive at your site.
Advanced Google Analytics Metrics for 2025
Now, let’s go a step further. We’ll look at some of the more advanced Google Analytics metrics to track. These are the metrics that will give you an edge over others. It gets better because these metrics focus on the full customer journey.
Event Tracking (Clicks, Downloads, Video Views)
In GA4, everything is an event. Events enable you to track specific user actions that extend beyond simple page views. This includes clicks on a button, a file download, or a video view.
Setting up conversion tracking in GA4 for these events is a must. It is a great way to see what actions your users are taking. It also shows which parts of your site are the most engaging.
Customer Acquisition Cost (CAC)
Customer Acquisition Cost (CAC) is a key website performance metric. It is the total cost of your marketing campaign divided by the number of new customers acquired. While not a native GA4 metric, you can track it by bringing your ad spend data into a tool like Looker Studio.
Then, you can combine it with your GA4 conversion data. Knowing your CAC is key to seeing if your marketing campaigns are profitable. A 2025 report on e-commerce metrics emphasises that understanding your CAC is key for business growth.
Lifetime Value (LTV)
Lifetime Value (LTV) is the total money a customer is likely to spend with your business over time. Like CAC, this needs data from many places, including Google Analytics.
LTV is one of the most important marketing KPIs from Google Analytics you can measure. It helps you see the true value of your customers.
E-commerce Metrics (Transactions, Revenue, Cart Abandonment)
For e-commerce stores, there are a few must-have Google Analytics metrics to track. Transactions and Revenue track the number of sales and their total value. Cart Abandonment Rate, on the other hand, refers to the percentage of users who add items to their cart but leave before completing a purchase.
A 2025 study by DesignRush reveals that mobile commerce will account for 59% of all e-commerce sales. This makes these metrics even more important for mobile businesses. The bottom line? These numbers help you find problems in your checkout process.
Read Also:
How to Choose the Right Metrics for Your Business Goals
But you’re probably wondering, how do you know which metrics are right for you? It all comes down to your business goals.
A metric is only as good as the question it answers. You wouldn’t use a wrench to hammer a nail, right? The same goes for metrics.
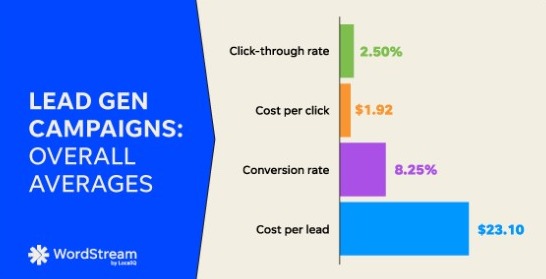
Image Credit: WordStream
For marketing teams
Your focus should be on getting and converting customers. You need to know which channels bring in the most traffic and which ones lead to sales. You should be watching traffic sources, goal completions, and conversion rate.
For e-commerce stores
Your most important metrics are those related to money and profit. You will want to track transactions, average order value, and cart abandonment rate.
It gets better: with GA4’s e-commerce tracking, you can go even deeper. You can examine how well products are performing and what users do during checkout.
For content creators
The key phrase synonym to track would be engagement. You need to know if your content is connecting with your audience. This means focusing on metrics like average engagement time, pages per session, and top landing pages. These numbers will tell you which content works best.
For service-based businesses
You should focus on generating leads. Your key phrase synonym to track will be goal completions and conversion rate.
For example, you will want to track form submissions or clicks on a “request a quote” button. You can also use event tracking in GA4 to watch clicks on your phone number or email.
Common Mistakes When Tracking Google Analytics Metrics
And bada bing, bada boom, you’re set. Well, not quite yet. There are some common mistakes that can lead you astray. Avoiding these mistakes is just as important as knowing what to track.
Tracking too many metrics
Here’s an example: you log into Google Analytics and see a hundred different numbers. It is easy to get lost and forget your main goals.
Instead of trying to track everything, choose a few core Google Analytics metrics to track. Focus on those that match your business goals. This will give you clarity and direction.
Ignoring conversion goals
It’s true! You can have a lot of traffic, but if no one is taking the action you want, your efforts are wasted. A lot of users and page views mean nothing without a strong conversion rate.
Always set up and watch your conversion tracking in GA4 from the start.
Not setting up events properly
GA4’s event model is powerful, but only if it is set up correctly. Forgetting to set up events for key user actions means you are missing out on important data.
This is where a proper Google Analytics dashboard setup helps. It makes sure all your most important actions are being tracked.
Forgetting to segment data
Looking at your total traffic is beneficial, but examining traffic from a specific country or device is even more valuable. Dividing your data by factors such as traffic source or device can reveal insights you might otherwise miss.
Read Also:
- Top 10 Digital Marketing Experts to Follow in 2025
- Uncommon Marketing Job Titles and Career Path to Look Forward For
Tools and Dashboards to Simplify Tracking
Now: how do you make this all easy to manage? The good news? You do not have to check every report every day. There are tools that can make your work easier.
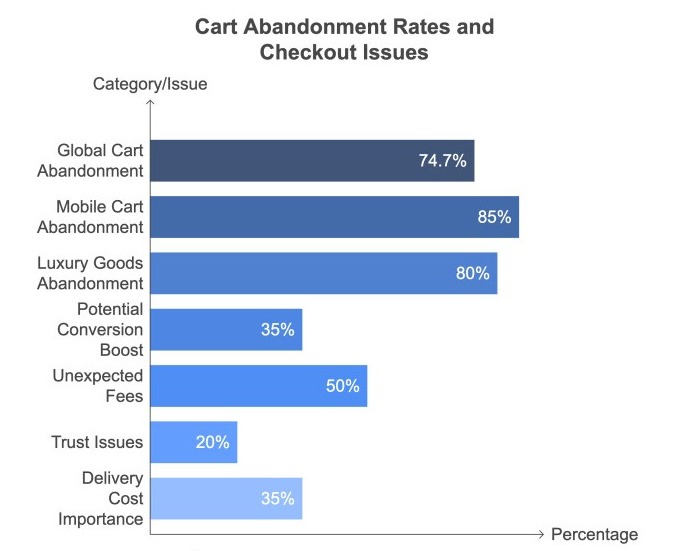
Image Credit: DesignRush
Google Analytics 4 (GA4) built-in reports
GA4 comes with ready-to-use reports. These include reports on getting new users, engagement, and money. They provide a quick overview of your key phrase synonym metrics.
You can also change these reports to show the most important Google Analytics metrics for your business.
Google Data Studio (Looker Studio)
This is a free tool from Google. It lets you create custom, shareable dashboards. You can pull data from many sources, including GA4 and Google Ads. This allows you to create a single dashboard that displays all your key phrase synonym metrics in one place.
This makes it easy to see and share your data with your team. A custom Google Analytics dashboard setup is the best way to track your marketing KPIs.
Custom dashboards for KPIs
By building your own dashboards, you can change your view to show only the marketing KPIs google analytics that matter most to you.
For example, an e-commerce dashboard might show revenue and sales. A content dashboard would display the average engagement time and the top-performing pages. This is how you can easily watch all the Google Analytics metrics to track.
Conclusion
So, what have we learned? Knowing and tracking the right Google Analytics metrics is not an option anymore; it’s the base of a smart plan. By focusing on the essential metrics we have discussed, you can move beyond simple numbers.
You can gain a better understanding of your audience, your site’s performance, and your marketing efforts. The most important thing is to use these insights to make good, strategic choices.
The journey from a beginner to an expert in web analytics is a long one. However, with this knowledge, you are well-equipped to navigate the digital world in 2025 and beyond. The future of digital marketing is in understanding data.
But what if you want to do more than just track? What if you want to become a master strategist? What if you want to turn data into great campaigns that drive huge growth? This is why our Digital Marketing Bootcamp is made for you.

Our bootcamp doesn’t only teach you what the numbers mean.
It also teaches you how to use them to beat your competitors. From basic analytics to advanced data-driven methods, our course will turn you into a data-smart marketing leader.
You will be ready for the challenges of tomorrow.
Don’t just track your performance; define it.
Sign up for the RKY Careers Digital Marketing Bootcamp today and turn your passion for data into a high-impact career.
FAQs: Google Analytics Metrics to Track (Essential Guide for 2025)
What is the most important metric to track in Google Analytics?
The most important metric is the one that fits your business goals. For most businesses, it is the conversion rate that matters. It measures the percentage of users who finish a desired action.
How do I track conversions in GA4?
In conversion tracking GA4, you track conversions by marking an “event” as a “key event.” You can use an existing event (such as a purchase) or create a custom one for actions like form submissions. Then, you just toggle the “Mark as key event” switch.
What is the difference between sessions and users in Google Analytics?
A “User” is one unique visitor to your website. A “Session” is a single visit by a user. One user can have many sessions. For example, if they visit your site on Monday and then come back on Wednesday.
How often should I check my Google Analytics metrics?
You should check your main metrics daily or weekly. This helps you spot problems quickly. For a deeper look, a monthly or quarterly review is good. This helps you check long-term performance and make bigger changes.