Descriptive vs Inferential Statistics Explained
Do you plan on transitioning into tech on data and you are scared of statistics? Worry not because descriptive vs inferential statistics is explained in a simple way in this post. Knowing this key difference is vital. It is the basis for good decisions. Learning these ideas can significantly boost your career.
You will use these methods whether you are a business or marketing professional. This is because all modern jobs rely on data for growth. Data-driven decisions are vital for business success. A 2024 study by BIO Web of Conferences found that businesses using data experienced a 46.15% increase in outcomes.
This demonstrates its importance. It applies to every work sector. Learning these core ideas helps you become a valued asset. The point is that mastering these skills is essential for professionals today.
What Are Descriptive and Inferential Statistics?
To understand what happened and why, you need to understand the distinction between descriptive vs inferential statistics, explained in simple terms. These two parts of statistics are key tools for anyone who looks at data.
They have different goals. However, they often work together to provide a comprehensive picture. Knowing their jobs is the first step. Let’s start with the basics.
Simple Definition of Descriptive Statistics
Simply put, descriptive statistics describe or summarise a set of data. They help you organise and present your data in a clear and easy way. This is usually the first step in any data task. Think about it: you are just describing what you see.
For instance, if you have a class of students, descriptive statistics can tell you the average test score. Another example is finding the median age of your customers. You would just find the middle value. The simple truth is, descriptive statistics only describe the data you have.
It does not allow you to make any broad conclusions beyond that specific dataset. It provides a clear picture of your information. This is why descriptive vs inferential statistics explained correctly starts with knowing your data.
Simple Definition of Inferential Statistics
On the other hand, inferential statistics help you make guesses or draw conclusions. It helps you draw ideas about a larger group. This is based on a smaller, representative sample of that group. Put it this way: instead of just describing your data, you are making an educated guess about a larger group.
For example, a political pollster surveys a small group of voters. The pollster uses those results to predict the outcome of a whole election. The data from the sample is used to make a guess. In other words, you are using a small sample to guess something about a much bigger population. That is the core of inferential statistics.
Read Also:
Key Differences Between Descriptive and Inferential Statistics
Now that we have the basic ideas, let’s get into the key differences between descriptive vs inferential statistics. The two methods cannot be used interchangeably. They have separate jobs and uses. Knowing which to use and when is crucial. Here’s the point: they each answer a different kind of question.
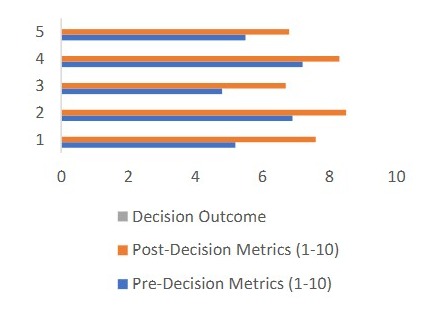
Image Credit: ResearchGate
Purpose and Scope of Each Method
The primary goal of descriptive statistics is to summarise and organise data. It answers the question, “What happened in this dataset?” The scope is limited to the data you have. It provides a brief overview.
For example, you might look at a company’s past year’s sales data. You would then calculate the total sales and the average monthly revenue. In contrast, the main goal of inferential statistics is to make guesses. It answers the question, “What can we predict about the whole population?” The scope is much wider.
You are taking a leap from your small sample to the general public. This difference is what gives inferential statistics its real power. It is what makes descriptive vs inferential statistics explained so valuable.
Data Requirements and Sample Sizes
Descriptive statistics do not have strict data rules. They can be used on any set of data. This is true whether it’s a small sample or a full population. The goal is just to describe the data. You do not need a specific sample size. You can easily calculate the average height of five people.
With inferential statistics, however, the rules for data analysis are much stricter. To make good conclusions, you must have a representative sample. The sample must truly show what the larger population is like.
If your sample is biased, your guesses will be wrong. The key to good inferential statistics is a well-designed sample. Understanding this helps you with descriptive vs inferential statistics explained.
Real-World Examples in Business and Research
Let’s look at some examples of descriptive vs inferential statistics in real life. In business, a company might use descriptive statistics to review its quarterly sales report. They would find the mean, median, and mode of sales. They would also create charts to show trends. It helps them understand their past performance.
Here’s an example: an e-commerce company uses descriptive vs inferential statistics examples to analyse its website traffic. They might find that the average user spends three minutes on a product page. This information simply describes user behavior on their site. It does not tell them what will happen tomorrow.
For inferential statistics, a market research company might conduct a survey of 500 people. They ask participants to identify their favorite soda brand. Based on this small group, they can guess what percentage of the city’s population prefers that brand. This distinction between descriptive and inferential statistics is the foundation of market research.
For business, descriptive statistics vs inferential statistics in business is all about moving from simple facts to making smart choices for the future. This is a classic example of difference between descriptive and inferential statistics. It allows a company to make an informed choice.
For instance, they can decide how much soda to stock. The data from the sample is used to make a broader conclusion about the market. Without inferential statistics, this would just be guesswork. The power of descriptive statistics vs inferential statistics in business is clear.
Read Also:
When to Use Descriptive vs Inferential Statistics
Knowing when to use descriptive vs inferential statistics is a crucial part of any data task. It all depends on your final goal. Are you simply trying to describe data? Or are you trying to make a guess? This section will help you decide.
Analysing Data Trends for Reporting (Descriptive)
Descriptive statistics in research is vital. You use them when you need to give a clear summary of your data for a report. For example, a public health researcher might want to display the number of people with a specific disease in a particular city. They would use descriptive statistics to report the total count.
Consider this: they might also calculate the average age of individuals with the disease. This is a perfect example of descriptive statistics in research. The data describes the current state. It does not try to guess future outcomes. The sole purpose is to give a clear, factual report.
Making Predictions and Hypothesis Testing (Inferential)
On the other hand, you use inferential statistics in research to test a belief. Let’s say a medical researcher wants to determine if a new drug is more effective than an existing one. They would give the new drug to one group and the old one to another. Then they would use inferential statistics to see if the difference is truly meaningful.
This is the power of inferential vs descriptive statistics simplified. It helps researchers draw powerful conclusions. For example, a political analyst wants to predict election results. They survey a small, random group of voters, then use inferential statistics to predict the winner. They are making a guess about the entire population.
Combining Both for Stronger Insights
The most powerful way is to combine both methods. They work well together. You use descriptive statistics to gain an understanding of your data. You clean, organise, and summarise it. Then you use inferential statistics to draw more general conclusions and make predictions. This is descriptive and inferential statistics in data analysis in practice.
For example, a company uses descriptive statistics to check customer feedback. They find the average rating is 4.5 out of 5. Now, they want to know if this rating is true for all their customers. They use inferential statistics to determine if their sample is large enough to make a valid inference about their entire customer base. This is a great example of descriptive and inferential statistics in data analysis.
Common Tools and Techniques Used
Now, let’s explore some of the common tools you’ll see. Understanding the tools can make all the difference in your career. Here’s the point: descriptive vs inferential statistics explained in real life means knowing which tools to use. The good news is, you can learn all of these.

Charts, Graphs, and Summaries in Descriptive Statistics
- Charts and Graphs: Descriptive statistics are shown with pictures. This makes the data easy to understand. Examples include bar charts and pie charts. They help you quickly see patterns and trends.
- Summaries: You also use numbers to summarise data. The mean, median, and standard deviation are important statistical measures. The mean tells you the average number.
Regression, t-tests, and Probability in Inferential Statistics
- Regression: Inferential statistics use more complex math. A tool called regression helps you find links between different things. For example, you can use it to guess future sales by looking at how much money was spent on marketing.
- t-tests: Another key tool is the t-test. It is used to compare the averages of two groups. This helps you determine if a difference is real or just a result of chance. For example, a t-test can demonstrate that a new medicine is more effective.
- Probability: These methods let you use chance to make good decisions. This is the main point of inferential vs descriptive statistics simplified.
Software for Statistical Analysis (Excel, SPSS, Python, R)
- Excel: Data analysis methods for beginners start with tools they already know. Excel is a great tool for simple math and making charts.
- SPSS: For more complex work, software like SPSS is a good choice. It is a popular research tool with an easy-to-use interface.
- Python: For a more automated way of working, languages like Python are vital. Python has libraries like NumPy and Pandas, which are very powerful for handling large amounts of data.
- R: R is a language created just for statistics. Both R and Python are essential for modern data science.
Read Also:
Conclusion
So, there you have it, the descriptive vs inferential statistics explained in detail. The bottom line is, these two parts of statistics are the basic building blocks of data analysis. Descriptive statistics help you describe a dataset and give a clear report. Inferential statistics, however, allow you to take that info and make powerful guesses and smart decisions about the future.
The distinction between descriptive and inferential statistics is what makes data a powerful tool. In a competitive professional world, these skills are no longer a nice-to-have. They are a must-have. The good news is that these skills can be easily applied across various jobs.

Do you want to master these skills and move up in your career? We have shown you the basics of inferential vs descriptive statistics simplified. Now, you can take the next step towards a career in data analytics.
Our data analysis bootcamp at RKY Careers can provide you with the necessary knowledge to become an expert. Our courses cover a wide range of topics, from fundamental concepts to advanced tools. Take control of your career today and book a consultation to learn more.
FAQs
What is the main difference between descriptive and inferential statistics in simple terms?
The main difference is that descriptive statistics summarise data you have, while inferential statistics use that data to make predictions about a larger population. This is the essence of descriptive vs inferential statistics explained.
Can descriptive statistics be used for predictions?
No, descriptive statistics are limited to describing the data you have. They cannot be used to make predictions or guesses about a larger population.
What are examples of inferential statistics used in everyday life?
A few common examples of descriptive vs inferential statistics in business and everyday life include political polling, market research surveys, and medical trials for new drugs.
Which is more important: descriptive statistics or inferential statistics?
Both are equally important and often work together. Descriptive statistics give you the facts, while inferential statistics help you draw conclusions and make predictions. You need both for a full analysis. This is the answer to the question of when to use descriptive vs inferential statistics.